Miami & Miami Beach Condo Trends – April 2010
April 26, 2010 by Lucas Lechuga
Once again, I divided the supply figures into seven price ranges and included only sales that have closed within the past six months. The last three columns show the percentage change in those statistics when compared to those published nine months earlier for July 2009. It should be rather apparent, with a few exceptions, that the overall pattern is that condo inventory has decreased and closed sales have increased quite considerably within the past nine months. For example, overall condo inventory in Miami-Dade County has decreased 13.78 percent while closed sales have increased 19.23 percent during that time frame which led to a 27.69 percent decrease in the overall months of supply.
The figures in the images below may be a bit difficult to read so I also published the workbook for this month's Miami & Miami Beach Condo Trends in its entirety. Be sure to check it out. The worksheet and graph tabs can be found along the bottom of the workbook.
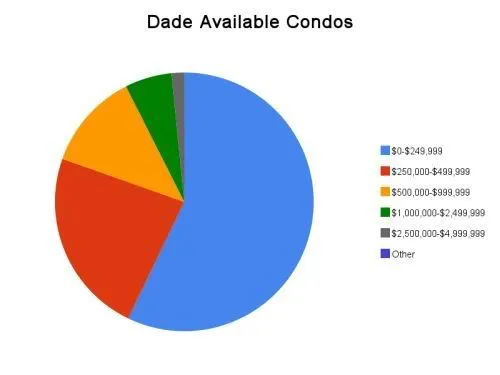
Below, you will find the Miami-Dade County condo supply and sales figures for April 2010:


The following statistics encompass only those condos located throughout Miami (not other areas of Dade County such as Miami Beach, Aventura, Sunny Isles Beach, etc.):


The following statistics encompass only those condos located throughout Miami Beach:


Market pessimists will likely argue that the statistics above do not incorporate developer inventory. Commonly known as shadow inventory, developer inventory is typically not recorded in the MLS. However, these people need to bear in mind that closed developer sales also are not included in the figures above. Obviously, shadow inventory was a bigger problem nine months ago than it is today. A more valid argument should point to the home buyer tax credit being the catalyst that increased sales within the past nine months. Personally, however, I feel that the the home buyer tax credit has had a greater impact on the single family home market than the condo market. It has played a very insignificant role in our business and I have spoken to other real estate agents who specialize in condominiums who have encountered the same. With the home buyer tax credit expiring this Friday, we should be able to see within the next three months how instrumental of a role it has played in the increased sales numbers we've witnessed.
Owner at infinity, you said “I was told that the deevloper/Starwood is in no hurry to sell out the building since they have a interest free loan from FDIC”
Infact same holds true for Paramount. It seems they have such a sweet heart deal from the holders of the note, that the current owners of Paramount can afford to just sit on the property for many months with out having to do any major discounting. That is why I do not expect Paramount to be less than $400/sf when they do decide to open the building for sale. They are just waiting for the remaining inventory in the market to dry up. That is a very bold plan and ambitious too. But it also shows that they are severely confident to sell all their units at a profit (after all they only paid half the debt to own the property). Looks like they are on the right track.
why bother,
I agree I think that is what they will try to do.
12% unemployment…that is all.
seems like the market activity is dominated by the under $250k price range. since quite a bit of inventory is caught up in Everglades, Icon and Paramount, which expect to price way outside of this range, any idea, based on the numbers above, how these units will fare in the next year?
remember, the old numbers were calculated during the worst financial crisis in decades. one would expect better numbers today compared to then-we are no longer in a total collapse but sputtering forward. what would be really interesting is to see some numbers from the 2001-2003 years, when we still had behavior closer to historical norms. how does our activity stack up to that period? if we have less activity than 8 years ago i would have some concern. Lucas is it possible to dig up some numbers like this? Gixxer you also like to play with the numbers as well. any luck?
I am a skeptic, but numbers don’t lie!
Do these numbers count bulk sales? I know since July last year bulk sale activity has been pretty common.
As gables pointed out the large majority is <$250K prices. I have always argued affordability (which is different from the ability to get loans.) <$250K is affordable and even the <$500K for dual incomes or a single high income earner.
I guess my confusion is the large spread between available prices and sold prices. Regardless it is good to get these buildings filling up. You can see downtown starting to shift from sketchy electronics and luggage shops to welcoming cafes, bistros and restaurants.
gables,
The information I have for condos only goes back to 2005. But I have data for single family homes going back further. This should give you some ideal about sales volume.
Yearly Sales Volume
SFH
2000 11,718
2001 11,491
2002 12,342
2003 12,571
2004 12,622
2005 11,016
2006 8,692
2007 5289
2008 4,379
2009 6,685
Condos
2005 13,009
2006 9,822
2007 5,772
2008 4,580
2009 6,854
As you can see the activity today is less than it was 8 years ago. But contrary to your argument that is a good thing. This means we still have room for improvement. If the sales volume was close to the historical norms then you could conclude that the sales activity most likely wont increase from today’s level. But since the sales volume is still well below historical norms its easier to rationalize that sales volume will continue to go up for some time.
The argument that you are making is very psychological and irrational. Your argument is that since we were at a low the increase in not significant as to you that is the only option. But you leave out the option that we could have stayed at a low or worse continued to go lower.
Ex. You normally travel at 65 mph. You then drop to 10 mph. You are now traveling at 30 mph and increasing. You are looking at this and seeing that you are still traveling 35 mph slower than before. But the problem is that there is no way to get back to 65 mph without increasing through, 35, 45, 55, etc, which is what were doing now. We are already on track to sell even more than we did in 2009. This should continue each year until we get back to historical norms.
Another thing I would like to point out is that when you look at year over year sales, they really began rising around late 2008 early 2009. The dramatic increase in sales is what helped prices to bottom in the 2nd quarter of 2009.
as we ramp up consumption of these units, the question begs: can we continue to devour an equal or more units per month into the future? remember investor units really become shadow inventory unless the investor is truly committed to renting long term. otherwise it’s a unit that will be back onto the market in a couple of years. but the numbers certainly indicate within a few years the downtown area will be a much better destination for living than a few years ago. now we search for what premium is to be had for that location???
I guess the question is why would you think we couldn’t sell an equal number or more units per month into the future. Again your questions are more emotional and not based on the market.
In a normal market we sell about 20,000 homes per year. We fell into a recession at which point we were selling 9,000 homes per year given that economic climate. The economic climate has gotten better to the point where we are selling 13,000 homes per year. If the economic climate is going to stay the same or get better then why would the number of homes sold do anything but stay the same or get better?
Two points that I would like to append to the information offered in this article.
There are still market distortions being created at the bequest of legislative entities in lieu of banks. These are anomalous and must go away at some point. Anyone taking the other side of that bet (read long real estate), is actually correlated with dollar erosion and all the minutiae that go along with it (another post entirely).
There was a very compelling revision in the HAMP legislation that has created a severe backlog in foreclosure proceedings. I can only speculate on this point but I know the fundamentals of the program are much more compelling for applicants than previous iterations which must stir more demand. Any data set outlining HAMP ramifications should not be trusted for reasons I will not go into at this time.
Demand and supply solutions respectively. Never in the history of bubbles (Rogoff amongst others) has one been successfully reflated. Lets keep a profitable perspective and let saner/lucid minds prevail.
Lou
I think as long as we don’t build large volumes of units the investor units and shadow inventory won’t be a problem.
We can’t overlook the fact that “historic” data includes a large number of so called investors buying properties to flip them and make a quick buck. I would bet the days of individuals buying 3 or 4 units and flipping them are over. There are still real investors who are making money today via bulk sales and real investments.
Gixxer, where is the 20,000 units a year from? Does it include years 2003-2008? Would like to know what the averages are from say 1998-2003-these will be less biased by investors and mortgage fraud of the past boom years. Any idea of the number of investor buys in the preboom years versus today? My understanding is that many of todays buyers are investors-was it the same a decade ago? If not, the current buy rate is not sustainable. As i said before, investor purchased units are tricky to count because they are expected to return to the market sooner rather than later. Investor purchases distort the residential market in ways that are very hard to predict over short and medium terms.
gixxer, remember the local south florida economy is in the tank and far from returning to the preboom days. Unemployment is reported anywhere between 10-12% rather than 5-6% in days of yore. There is a certain minimum housing number that must occur do to job transfers, family upgrades, etc that will occur regardless of economic conditions (absent the complete disaster of 2008-2009 which is beyond bad economic conditions). From your numbers, the new normal is probably closer to 13,000 than 20,000.
gables, I think gixer is including residential+condo in the 20,000 number.
Do you guys think the Miami government will be smart enough to not approve (or issue permits ) for new projects in Downtown for the next 5 years? If they don’t allow new development, Downtown Miami will be more than fine. However if they allow new construction on every block again…
Gixxer, you accuse someone of being irrational and emotional, your ten year sample hardly produces anything more than the illusion of rationality. Magnifying the danger is the fact that your sample size happens to be the biggest asset class dislocation ever witnessed. Any metric that is a function of real estate will be an outlier, any line chart makes this very apparent.
This is the 10 year treasury, what obvious distortion do you see and what pocket of time does it coincide with. Overlay that chart with your run rate sample.
Mean reversion is a bitch.
LSente:
How dare you question Gixxer’s methodology. Just analyze his “driving 65 mph…and then dropping speed…and then going 55 mph….”
Its so simple. The Miami real estate market is just like physics.
gables,
As Elvis pointed out I was simply adding SFH and condos. I wasn’t trying to be exact but instead just trying to prove a point. In the current economic climate, 12% unemployment and current prices we seem to not only be able to sustain the current sales volume but are increasing.
Your questions about investors is really pointless. There is a shortage of rental property downtown. There were a total of 22,079 condo units built downtown. At the same time there were only 1,189 apartments built downtown. A large portion of these condos are going to remain rental units for years to com.
Yes the unemployment rate is at 12%. However the job losses have stopped and we are at the point where we are beginning to add jobs. Each year from here on out the unemployment will slowly go lower, meaning more buyers next year and then more buyers the year after that. You make it seem as though unemployment is going to stay at 12% as the new normal rate. Unemployment in Miami-dade was at 10.4% in 1992. It took all the way until 1998 to work its way down to around 6%.
“From your numbers, the new normal is probably closer to 13,000 than 20,000.”
The normal goes up not down as the area is constantly growing. There are a lot more people in the area in 2010 than there were in 2000. We sold over 13,000 total homes in 2009 alone. If you were talking about just condos then I’d say your right. We’re at about 6,800 condos a year now and in normal times we should be just over 13,000.
Gixxer, those numbers show a strong down trend in the past 5 and 10 years. In particular, the past five years. And this is when supply (especially of condos) exploded upward. Does it not concern you that sales are nearly half of what they were 5 and even 10 years ago, amid an historic rise in supply? Once investors run out of money (and eventually they will after buying at great prices), we are left with regular homebuyers, who will be operating in tough and increasingly tougher credit markets. As interest rates rise (my bet is they will), you will lose additional potential buyers. not sure if we will see the same numbers of even 10 years ago in the forseeable future. this is what has so many government and corporate figures so concerned about the recover.
Simple question, how long can QE and ZIRP continue. There is your endgame, this is the argument that we are having, everything else is anecdotal.
Fiscal/monetary policy == right now they seem to be a perpetual elixir, a simple remedy. They must stop however, how close to punishing rates and massive increases in crude/other inputs is when the rubber hits the road. So banter back and forth about econ data, but remember, we are on a clock and normal is a moving target.
Gixxer, you seem to be a diligent student and all the best to you in your endeavors. This is not meant to be an ad-hominem attack, more a big picture appraisal to give this article perspective.
I hate to always be a contrarian, but I’m having a hard time seeing what Lucas is so fired up about. Are we really supposed to be thrilled Miami is down to a 12-month inventory of condos worth $0 to $250,000? Is that what the allegedly “upscale Miami market” has come to — a celebration of bargain-basement sales?
The very same charts show a 26-month inventory of condos worth $250,000 to $500,000. These are the very same units that, just 2-3 years ago, investors and realtors routinely derided as “starter homes” and “cookie-cutter condos.”
Even worse, the chart shows a 31-month supply in the $500,000 to $999,999 range; a 30-month supply in the $1,000,000 to $2,499,999 range; and a whopping 55-month supply of condos priced $2,500,000 to $5,000,000.
Seriously — this is the big “recovery” we’re supposed to be celebrating? The average Miami r.e. sale these days looks like it came straight out of the property transfer listings in upstate New York or suburban Illinois or other places like that, not an allegedly “upscale” market like Miami.
gables,
“Gixxer, those numbers show a strong down trend in the past 5 and 10 years. In particular, the past five years. And this is when supply (especially of condos) exploded upward. Does it not concern you that sales are nearly half of what they were 5 and even 10 years ago, amid an historic rise in supply?”
You sure do a have a funny sense of logic.
Sales are half of what the were 5 or 10 year ago because the economy is worse than what it was 5 or 10 years ago. Once the economy gets back to normal then sales will get back to normal. What’s hard to understand about that??
The economy was worse in 2008 therefore sales were worse in 2008. The economy got better in 2009 therefore sales got better in 2009. The economy is already doing better at the beginning of 2010 and sales are doing better at the beginning of 2010. It doesn’t take a rocket scientist to see where this is headed.
“Once investors run out of money (and eventually they will after buying at great prices), we are left with regular homebuyers, who will be operating in tough and increasingly tougher credit markets.”
Again when looking at the downtown market it’s about 50/50 renter to owner. It’s likely to stay that way for some time. You make it seem as though buying these units today are going to dump these 5,000 condos onto the market a year from now. They bought them at rates that make it affordable for them to rent at. Why would they try and dump all the unit on the market to depress prices. If anything you can see investors and developers doing the opposite. Now that they can afford to hold these condos they are going to do so as long as the market rises. With nothing in the pipeline downtown will be at a shortage of housing in within 5 years.
Also, I don’t know if I would really call this a “historic rise in supply”.
Miami-Dade housing units
2000 852,278
2008 979,082
Miami-Dade Population
2000 2,253,362
2008 2,398,245
In that 8 year span housing grew by 144,883 units while the population grew by 126,804 people. Did they overbuild, yes. But by no means historical. More housing units were built during the early 70’s than were in the recent housing boom.
A nice Goldman giggle posted on CR 🙂
“You want the truth? You can’t handle the truth. Son, we live in a country with an investment gap. And that gap needs to be filled by men with money. Who’s gonna do it? You? You, Middle Class Consumer? Goldman Sachs has a greater responsibility than you can possibly fathom. You weep for Lehman and you curse derivatives. You have that luxury. You have the luxury of not knowing what we know: that Lehman’s death, while tragic, probably saved the financial system. And that Goldman’s existence, while grotesque and incomprehensible to you, saves pension funds. You don’t want the truth. Because deep down, in places you don’t talk about at parties, you want us to fill that investment gap. You need us to fill that gap. “We use words like credit default swaps, collateralized debt obligation, and securitization? We use these words as the backbone of a life spent investing in something. You use ’em as a punchline. We have neither the time nor the inclination to explain ourselves to a commoner who rises and sleeps under the blanket of the very credit we provide, and then questions the manner in which we provide it! We’d rather you just said thank you and paid your taxes on time. Otherwise, we suggest you get an account and start trading. Either way, we don’t give a damn what you think you’re entitled to!”
Gixxer, the economy leading up to the bubble was fueled on credit and not normal at all. From around 2000 until the bust, we had stock/tech and then RE, both bubbles which created environments which were not normal. we will be lucky to have a normal economic environment which matches that period. so i ask the question, if we do return to a normal, what will that level be? we have not had a normal economic environment in quite a long time. to think we will only drop back to the early 2000 time period is ignoring the bubbles that occurred then as well. this is why economists talk of the new normal-its an unknown of significant consequences.
Joe,
Lucas is fired up because he know how to actual read and understand information.
Look at the last time he posed numbers. If you look at the break out for just Miami and look at the $250k -$500k range which is where most downtown condos fall you can see that there was a 53.62 month supply. Now if you look at the same segment today you see that there is a 32.33 month supply. That’s a difference of 21.29 months of supply in just 9 months. Why would you not be excited about that. Of course the supply isn’t going to disappear over night. But going from 53 months to 32 months in only 9 months seems like were on the right track.
And more condos will probably be sold this year than last year meaning we’ll go through the inventory at an even faster rate. I told you all of this before. Although I think I had overall supply at 14 months not 16. You’re failure to understand simple mathematics is perplexing.
Gixxer,
The “historic rise in supply” is in condos requiring incomes far greater than the median income of Miami-Dade. ie. the condos that are the very focus of this blog.
Looking at historical housing data from overall Miami Dade where the median income is about $40-50K isn’t very relevant to the condo segment we talk about.
There’s no doubt the $200+/sq ft Miami condo overbuild is historic.
In other words, if you’re used to seeing 2 or 3 cranes in Back Bay Beantown putting up high-rise condos and then for 7 years straight you suddenly see 12 cranes putting up high rise condos targeting a pricepoint that is 3x the median income of Boston, that would be analagous to what Miami just went thru.
It’s easy to get lost in finding and then analyzing the relevant data… but if you actually lived thru the boom, you wouldn’t need anything more than to have seen all the cranes go up to grasp this “epic” buildout.
Gixxer 1000 said: “In that 8 year span housing grew by 144,883 units while the population grew by 126,804 people. Did they overbuild, yes. But by no means historical. More housing units were built during the early 70’s than were in the recent housing boom.”
— Really? For every person who moved into Miami over the past decade, *1.2* homes were built. Unless a huge population of rich, single, childless people moved into Miami while I wasn’t looking, I’d say it was indeed a “historical” overbuild.
——
Gixxer 1000 said: “You’re failure to understand simple mathematics is perplexing.”
— But not as perplexing as *your* repeated failure to grasp simple grammar.
——
Gixxer 1000 said: “Look at the last time he posed numbers. If you look at the break out for just Miami and look at the $250k -$500k range which is where most downtown condos fall you can see that there was a 53.62 month supply. Now if you look at the same segment today you see that there is a 32.33 month supply. That’s a difference of 21.29 months of supply in just 9 months. Why would you not be excited about that. Of course the supply isn’t going to disappear over night. But going from 53 months to 32 months in only 9 months seems like were on the right track.”
— Um, is this a joke? Do you really believe 21 months of supply in the $250,000 to $500,000 segment actually was SOLD in just 9 months, rather than simply being pushed down (via price decreases) into the $0 to $249,999 segment and/or shifted to the rental market?
Please try to mix in a little honesty with your “analysis” rather than peeing on our legs and telling us it’s raining. 21 months’ worth of condos priced $250k to $500k assuredly did NOT sell in the past 9 months; rather, the supply was depleted largely by (downward) segment-shift and rentals. This is plainly obvious from the above charts and sales numbers. (And you claim *I* don’t know how to read charts or numbers? Ha ha ha ha ha.)
no need to quote and bash each other. Gixer makes good points and so do many others. One thing I have learned is you can present any set of numbers and analyze them in any way which helps prove your point.
I know that the condo supply has dwindled in the last year. For example in Met1 where I live about 9 months ago the developer started renting out units. At that time about 1/3 of the ~440 units were sold and now we have at least 300 units occupied. In addition there was a bulk sale of 80 units at the end of the year.
So from actually living in the ‘Miami ground zero’ I see the inventory shrinking, but not necessarily sold properties at market rates. I would be interested to know how many of the units were actually sold to people (not LLC’s) instead of bulk investors and developer rental programs.
Elvis, you make a valid point regarding the LLC’s. Look at the ownership list of many new condo buildings-an absurd number are owned by LLC’s. Many developers turned their remaining units over to LLC’s probably in an administrative move-the LLC names seem to indicate a link to the developer. These units will eventually come onto the market. Most likely at a loss, albeit over several years of somebody else carrying the cost.
Joe is on the money regarding the transition of >$250k units into the under $250k unit range. While this may not explain all the changes, it certainly was not an insignificant number of units. If the RE market does stabilize, then we will see a rather odd trend of over $250k supply increase as prices are marked back up again. Not my prediction, but still an interesting possibility. Couple that with shadow inventory hitting the market if prices rise, and will be interesting to see how the market responds.
Another story about the proposed Publix in the Arts District at 1776 Biscayne Blvd:
Lucas, are your sales/rental listings updated daily on this site? Just curious whether we see real time or some delay in the listings. Thanks for the great web site!
Joe,
“Um, is this a joke? Do you really believe 21 months of supply in the $250,000 to $500,000 segment actually was SOLD in just 9 months, rather than simply being pushed down (via price decreases) into the $0 to $249,999 segment and/or shifted to the rental market?”
Are people here really that ignorant. The term “supply” is relative. It changes each month depending on the number of houses you’re selling each month. If you have 1000 houses and your only selling 100 a month then you have 10 months of supply(1000/100 = 10). But if you start selling 200 houses each month, even if the number of houses on the market stays at 1000 you now have 5 months supply. That doesn’t mean that you actually sold 5 months of supply. If you can’t understand this then your an idiot. I think you are confusing INVENTORY with SUPPLY. INVENTORY was reduced by 242 units and SUPPLY was reduced by 21 months.
The last time Lucas calculated supply there were 1,546 condos in the $250k – $500k price range. The reason there was 53.62 months of supply was because they were selling an average of 28.83 (1,546/28.83 = 53.62) condos in this price range a month. Now there are 1,304 condos in this price range. That’s only 242 condos less. The reason that the calculation for the supply is drastically different is because now were selling an average of 40.33 condos in this price range per month (1,304/40.33 = 32.33).
Gixxer 1000 said: “Are people here really that ignorant. The term “supply” is relative. It changes each month depending on the number of houses you’re selling each month.”
— Nice try, but if supply is relative and nothing to get fired up about, then why did you say this less just 24 hours ago:
“Look at the last time he posed numbers. If you look at the break out for just Miami and look at the $250k -$500k range which is where most downtown condos fall you can see that there was a 53.62 month supply. Now if you look at the same segment today you see that there is a 32.33 month supply. That’s a difference of 21.29 months of supply in just 9 months. Why would you not be excited about that. Of course the supply isn’t going to disappear over night. But going from 53 months to 32 months in only 9 months seems like were on the right track.”
——
So, yesterday, Gixxer 1000 asks, “Why would you not be excited about that?” but then, today, dissembles and claims people would have to be “ignorant” to not know it was mostly a paper improvement rather than a real-world improvement based on a huge uptick in actual sales. Shameless.
“So, yesterday, Gixxer 1000 asks, “Why would you not be excited about that?” but then, today, dissembles and claims people would have to be “ignorant” to not know it was mostly a paper improvement rather than a real-world improvement based on a huge uptick in actual sales. Shameless.”
Are you really that clueless. There was a HUGE uptick in actual sales. I don’t see how you can’t understand this. I mean its not like someone is telling this to you. It’s typed in. You can read it multiple times, even slowly if you like. These condos increased their sales by 40% in 9 months!!!
You have 50 apples to sell. You want to sell them as quickly as you can. But you’re only selling 5 apples a month. So at that rate you PROJECT that it will take you 10 months to sell all of you apples (50/5 = 10). Then the next month you look at your orders and you realize that you sales have jumped to 7 apples per month. You’re sales have gone up by 40%. Now it will take you only 7 months instead of 10 months to sell those apples. Why would someone in the business of selling apples not get excited about this. That’s 40% more business.
The only reason there was ever a PROJECTED 53.62 months of supply of these condos was because they were only selling 28.83 condos a month. That rate has gone up by 40% to 40.33 and continues to go higher. Year over year condo sales have been going up since late 2008.
Lucas is using the past six months to project the future volume of condo sales. This projection usually works best in a situation where sales are constant. But as I just mention year over year sales have been increasing for over a year. These condos are selling at a faster rate today then they were 6 months ago. So his monthly supply projection is conservative at best. If he used sales from just the last 3 months you would get an even lower supply projection. Or if he waits three months from now and calculates the supply again it will have drastically reduced again. This will continue to happen as long as the the sales volume continues to increase, which it has now for over a year and a half.
Gixxer 1000 — You’re the living embodiment of how statistics don’t lie, but liars use statistics.
For one thing, your “HUGE uptick in actual sales” was from 28 units per month to 40 units per month in the $250k to $500k price segment. That’s a grand total of 144 additional sales over a 12-month period. If you call that a “HUGE” sales number, for an allegedly upscale, luxury market like Miami, and with mortgage rates at historic lows (and every imaginable incentive under the sun available to buyers), you’re crazy.
For another, you’re not even being honest enough to make an apples to apples comparison. As I pointed out above, a lot of the condos that were in last year’s $250k to $500k price segment got bumped down into the $0 to $250k segment, and a lot of condos from last year’s $500k to $1M segment were bumped down into the current $250k to $500k segment. In real terms, this means that the current condos priced at $250k to $500k are, on average, much nicer than the ones priced at that same level last year, but even with the price decreases (and the low interest rates, and the buyer incentives), they’re not exactly flying off the MLS.
I don’t know why this is such a hard concept for you to understand, but just because a bunch of condos have seemingly disappeared from various price segments does NOT mean they were sold. It’s plainly obvious, after spending no more than 20 seconds looking at the above charts, that the overwhelming majority of the action in the Miami market is, and has been, in the $0 to $250k price segment. If you think that’s something to get real excited about, or that it bodes well for Miami in the short or intermediate terms, you’re nuts. I hate to lower myself to the level of hurling insults, but your “analysis” has become downright Orwellian, and your strident tone makes it all the more maddening.
Anyone have any info on Terra Beachside on 60th and Collins? Tia!
RE miami 2009
Terra Beachside is really Terra Roadside as it is sandwiched between the noisy northbound and the southbound lanes of Collins Ave on a narrow piece of land .
The floorplans looked quite decent and this had the potential to be a first rate project but in ANOTHER quieter location not smack in the middle of Collins ave.
Can not understand what motivated the developer to buy and develop this awful unliveable site -maybe he polled a focus group of the hearing impaired when he did his due diligence but..
I suggest that if you purchase there ask them to throw in earplugs to drown out the noise and gas masks to combat the fumes.
Joe, he is an idiot- don’t bother
I’ll continue to be the idiot that is right. We had this same discussion about supply at the end of January where I said there was between a 20 and 14 month supply of condos priced $500k and bellow. I ended the conversation with this:
“Listen, I’m done.
Let’s wait until Lucas puts an update out and then look at his numbers to see how many months of supply we currently have.
You have stated that in December ‘09 (which I consider current since its only January) the supply of condos $500k and under is almost 36 months.
I have stated that I think the current supply of condos $500k and under is closer to 14 months.
Maybe hearing it from someone else will help you to realize.”
Now let’s fast forward to now and look at the supply of condos priced $500k and bellow. Per Lucas’ current information there are 13,040 condos available priced $500k and bellow. We are currently averaging about 895 sales of condos $500k and bellow each month. That results in 14.56 (13,040/895 = 14.56) months supply of condos priced $500k and bellow.
So three months after we had this conversation Lucas’ numbers show we are in fact at 14 months supply. So three months ago I estimated 14 and Joe estimated 36. I think its obvious who understands what is going on who doesn’t.
Miami is like a physics.. thats it.lol
Greoge, thanks for the review of Terra. I just visited the complex. Liked the floorplans and overall the architecture is quite nice. You are right about the location however.
Too bad…maybe for the right price.
Looks like price reductions at Everglades on the Bay may become a reality in the near future:
I was very disappointed when I saw Everglades on the Bay recently….
It looks likes it is not being maintained when I saw it. It looked like a 5-10 year old buiilding rather then a 2 year old building. Both buildings already look like they need a paint job and the pool area’s concrete decking needs a good stream cleaning and pool furnture looked worn out already.
Many of the patios had sloppy stuff out on them showing that the developer is renting many of the 400 rental units to lowerclass peolpe.
Due to how dirty the exterior of the building is and how sloppy the patios are, the 2 two buildings look like buildings in some third world nation.
Gixxer 1000 — Your post #38 might be the most dishonest post in the history of this site.
I’ve been maintaining for a year now that almost all of the action in Miami is in the $0 to $250,000 segment, and NOTHING in Lucas’ updated numbers above disproves my point.
Further, for you to claim there’s only a “14-month supply” of condos priced at $500,000 and below is BLATANTLY DISHONEST. Lucas’ chart plainly states that there’s a 26-MONTH supply of condos priced at $250,000 to $500,000. The only way you’re coming up with your magic “14-month” number is by disingenuously adding the $0-250 and $250-500 segments and then averaging them, as if the $250-500 segment is selling at the same rate as the $0-250, which you know damn well isn’t true.
When I’m wrong, I say I’m wrong. But when you’re wrong, you try to convince us that 2+2=5. For God’s sake, give us a break already.
Everglades has A LOT of units. Curious if they came on the market now, what would their pricepoint have to be to sell out?
Joe,
Again you are have no comprehension. You make it seem like when people buy condos they only look at the $0 – $250k segment or the $250 – $500 segment. Lucas just broke these segments out as a guide. But he could have just as easily made the segments $0 – $200, $200 – $400, $400 – $600 etc. Or he could have made them $0 – $150k, $150k – $300, etc.
But regardless we were talking about ALL condos priced $500k and bellow. Here is your quote:
Joe Wrote:
“As of December 2009, there was almost a 3-year supply of condos available in the $500,000-and-under price range.”
You were claiming there was a 3 year supply in the $500k and under range. The $500 and under range also includes the $250k and under range. It encompasses all condos under $500k. And again when you look at the JUST the $500k and under range there is currently a 14 month supply. That isn’t dishonesty, that’s just fact.
As you go up in price the months of supply also goes up. With this limited information we don’t know how much of the supply is at $250k, $300k, $350k, $400k, $450k or $500k.
It’s not like someone goes into the market for only a $250k home. Is the supply going to change from 26 months if someone looks for a house that cost $251k down to 12 months if they drop their price to $249k????
“The only way you’re coming up with your magic “14-month” number is by disingenuously adding the $0-250 and $250-500 segments and then averaging them, as if the $250-500 segment is selling at the same rate as the $0-250, which you know damn well isn’t true.”
The numbers that Lucas’ posted are averages. I’m sure if you broke the segments out even further it would probably look something like this:
$0 – 100k 6 months
$100k – $200k 9 months
$200 – $300k 12 months
$300k – $400k 19 months
$400k – $500k 26 months
This would have probably been more helpful as most people don’t go buying houses with a range of $250k. In fact it probably would have been best at $50k intervals as I have rarely seen someones with a $100k range when looking at homes. But that would have been a lot more work so I’m not complaining.
If you are looking at a $300k condo then the supply of units is probably closer to 12 months than it is to 26 months. Is Lucas dishonest for grouping the $300k condos with the $480k condos which clearly are two different buyers??? No it was just a reference point. Which you clearly can’t understand.
You’re not even smart enough to realize when you’re wrong.
“New High: 22,000 Residences Under Contract In South Florida”
http://condovultures.com/home/5506–new-high-22000-residences-under-contract-in-south-florida.html
“Nearly half – about 46 percent – of the current pending contracts are in Miami-Dade County, which is home to Aventura, Miami Beach, and Sunny Isles Beach. Condos and townhouses account for more than 5,800 pending deals while single-family houses represent an additional 4,500 contracts, according to the report.”
As of 4/26/10 (4 days after Lucas’ numbers) they are showing 16,291 total condos available in Miami-Dade. At the same time they are showing 5,748 pending sales.
And seeing that the tax credit is set to expire I’d guess there are going to be a few more pending sales between 4/26 and 4/30 as people rush to hit the deadline.
Another thing to point out. Miami-Dade makes up 37% of the active listings but accounts for 46% of the pended sales.
Joe, Gixx, et. al:
BOYS! BOYS! BOYS! Don’t make me come back there and separate you!
Can’t we all just get along?
I think that what we need here are the facts. Is there available data on this “reverse bracket creep” – – meaning raw, cold, unflinching numbers concerning the number of condo units whose price began in range A but were shifted to range B or range C. Is there a report, chart, etc. showing, for example, that Unit 1000 in Development X was priced at $1.5 million in the first quarter of 2009 but was downgraded to $900k in the third quarter of 2009 and is now priced in $500k in the first quarter of 2010? Maybe a less specific survey would be easier? Can this data be quantified and published – — you choose the scale: monthly, quarterly.
I think that your disagreement – – for lack of a better word – – needs to be resolved because it is an interesting topic (once you separate the subjective characterizations from your arguments, that is).
Lucas: You are the statistical wizard here. Got anything?
scriv
interesting article, stating miami had the highest # of foreclosures in the 1st qtr, year on year, compared to any other metro area city, filings up 71% in the qtr:
http://finance.yahoo.com/news/The-worsthit-metro-areas-for-cnnm-972652490.html?x=0
Big article in the Herald today about the $8,000 tax-credit expiration and the “mad rush” of buyers trying to sign contracts in order to qualify on time.
Funny thing is, if most of these buyers wait an extra 6 mos or a year for prices to continue their fall, the discounted sales price will easily eclipse the $8,000 they’ll receive on their 2011 tax return. No realtors are talking about that, though…..
That’s weird because here are the foreclosure filling statistics for Miami-Dade county directly from the source:
1st Quarter 2009
Jan 6,063
Feb 5,942
Mar 7,103
Total 19,108
1st Quarter 2010
Jan 4,128
Feb 4,880
Mar 3,244
Total 12,252
Year over year foreclosure fillings are down 36%.
Actual foreclosures were also down 33% in the first quarter for Miami-Dade.